📊 Statistics
What you can do on this screen
The Statistics screen helps you understand where DNS traffic comes from and what dominates it. You mainly use it to:
- Identify domains, clients, or upstream servers that generate most traffic
- Jump directly to Logs filtered to a specific domain or client
- Compare trends across categories instead of checking only the current status
This screen is useful when something feels “known but unclear” and you want context before taking action.
Choose what you want to analyze
At the top of the screen, you see four tabs that switch between different statistical views:
- Queries & Servers (default)
- Domains
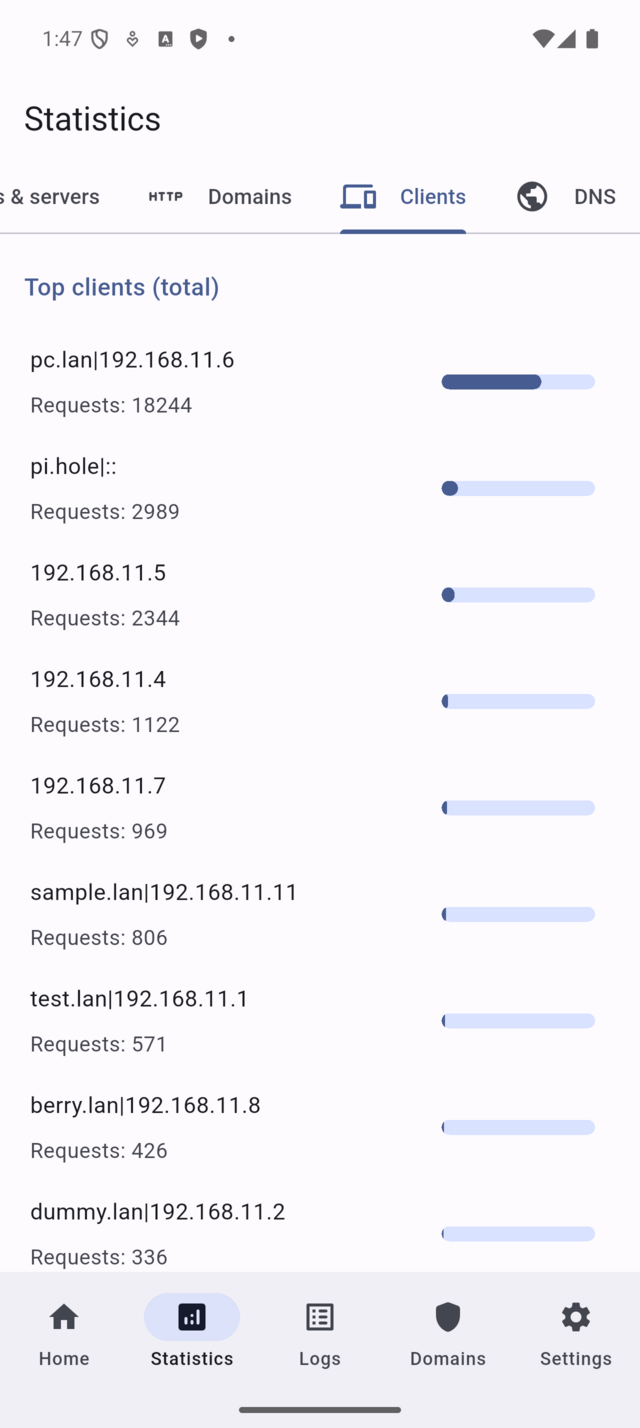
- Clients
- DNS (Pi-hole v6 only)
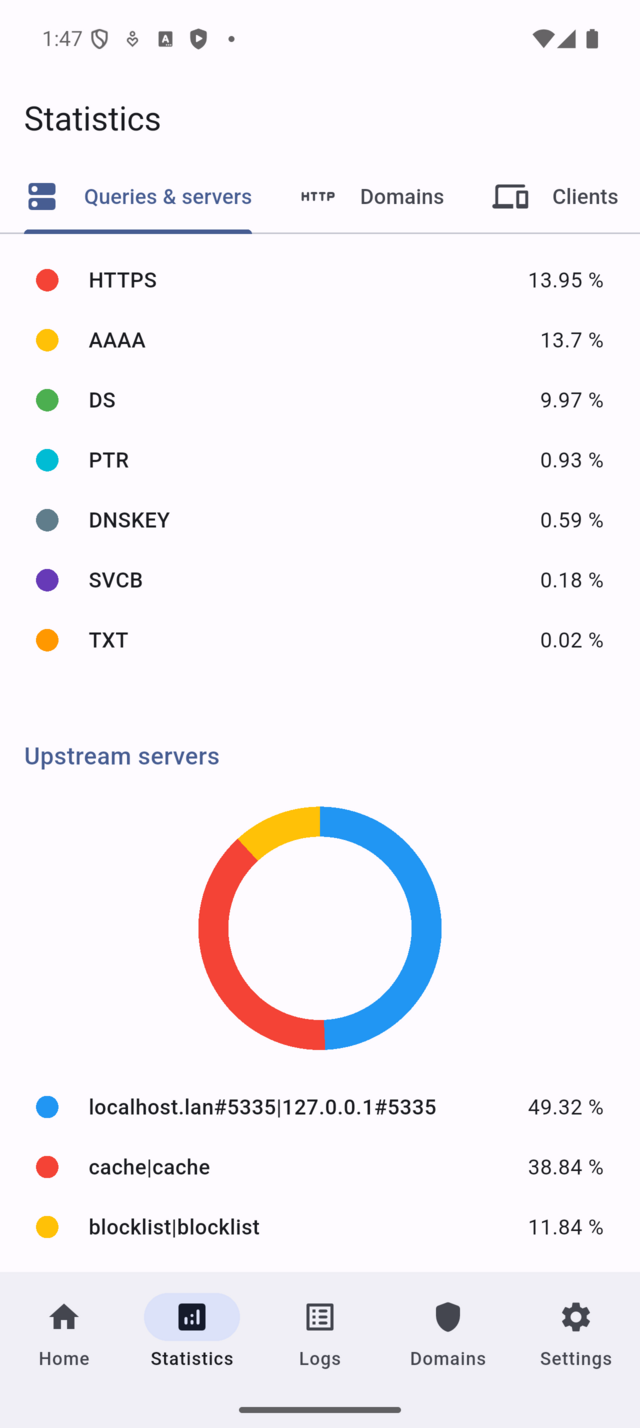
When you open the Statistics screen, Queries & Servers is selected by default. This view gives you a broad overview of total query volume and how traffic is distributed across upstream servers.
Tap another tab to update both the chart and the ranked list below it. The chart and the list always represent the same category.
Charts are visual only and cannot be tapped. Use them to spot patterns, then rely on the list to take action.
Use Queries & Servers as a starting point when you are not yet sure whether the issue is related to a domain, a client, or upstream routing.
If the DNS tab does not appear, the connected server is running Pi-hole v5. This is expected behavior and does not indicate a connection problem.
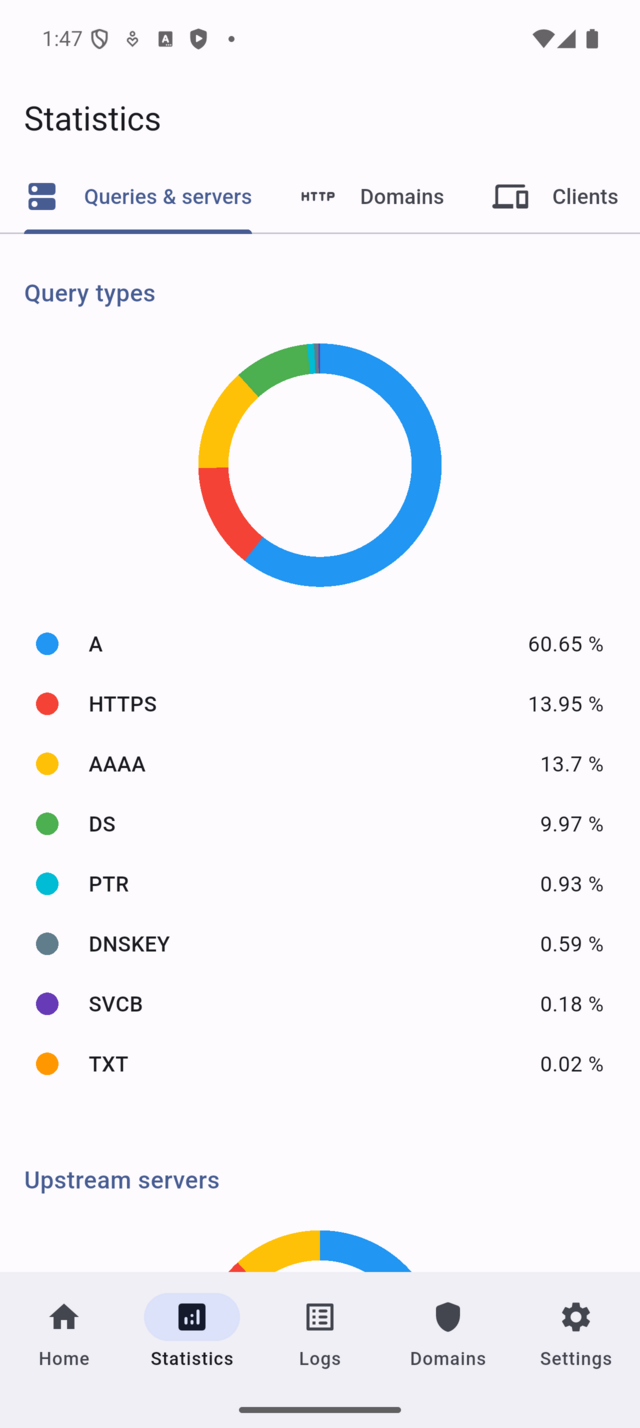
Read the chart first, then confirm with the list
After selecting a tab, start by looking at the chart. It shows how traffic is distributed over time or across items.
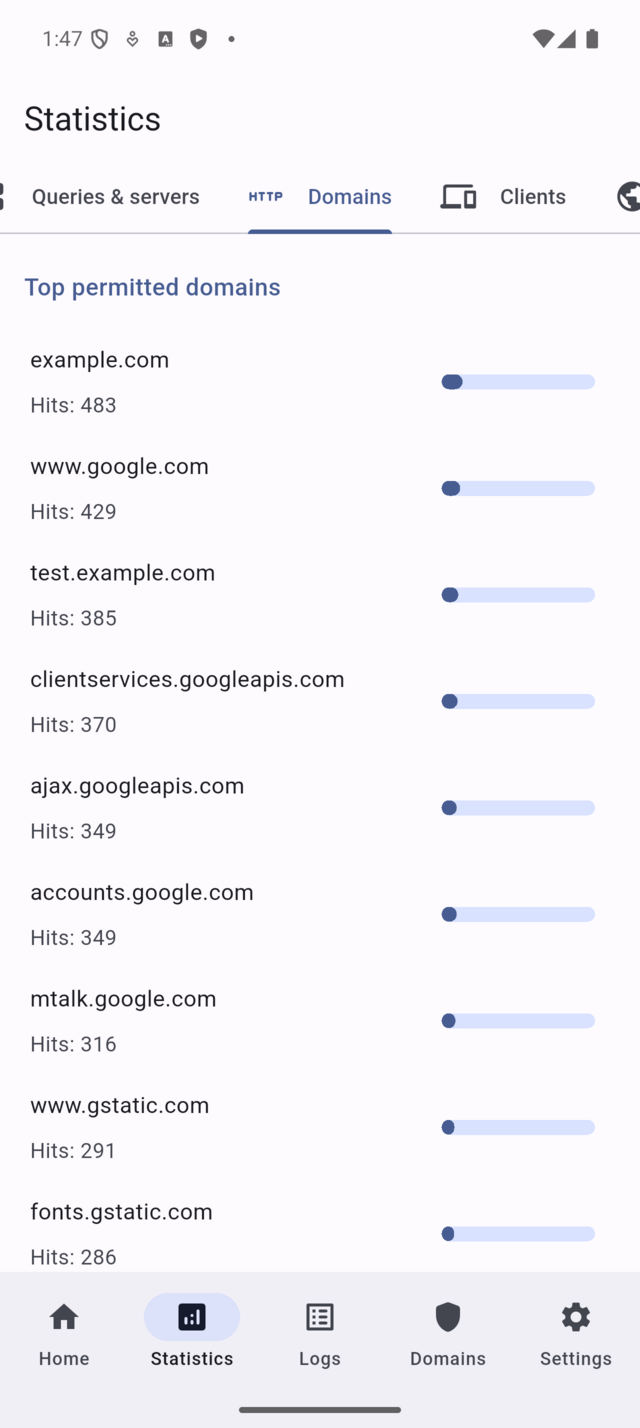
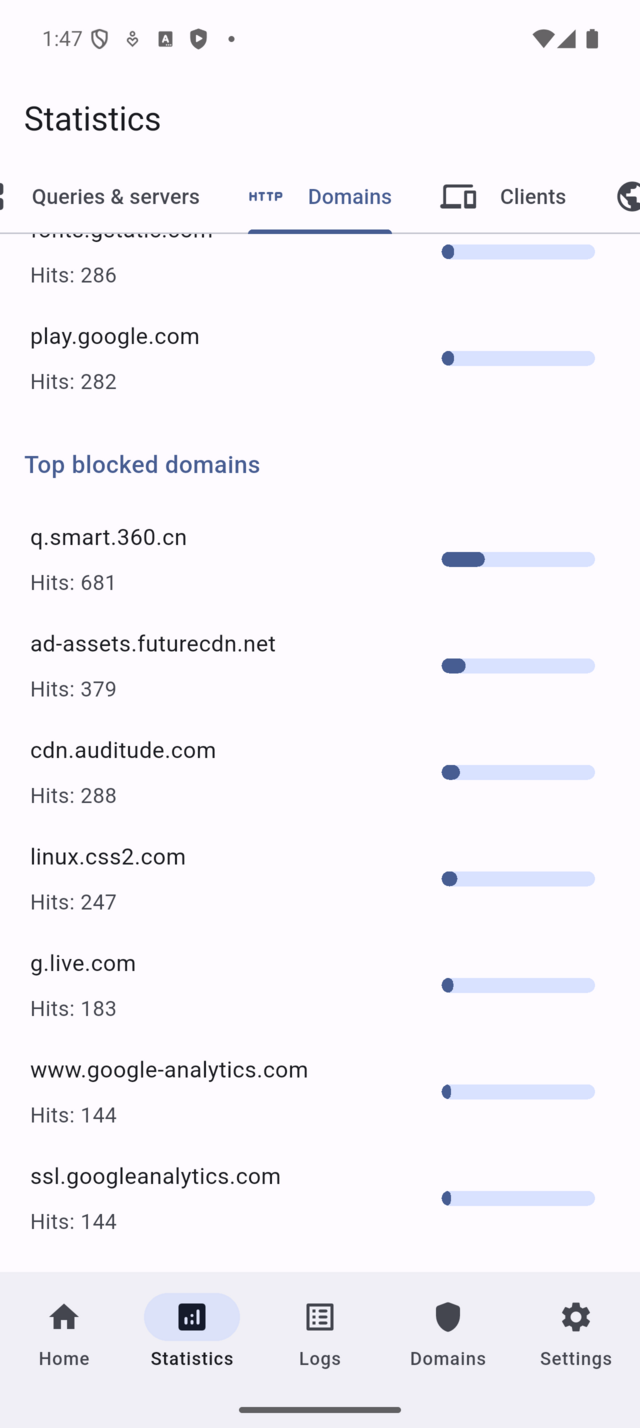
Below the chart, a ranked list appears for the same category. Each row represents one domain, client, or server, along with its percentage of total queries.
Use the chart to identify overall trends, then use the list to determine which specific item explains that trend.
If the list is hidden or empty, Pi-hole privacy settings may be restricting detailed data. In that case, avoid drawing strong conclusions from the chart alone.
Drill down into Logs from a list entry
Rows in the ranked list are tappable.
Tap a domain or client to open Logs with the corresponding filter already applied. This allows you to inspect individual queries immediately, without manually configuring filters.
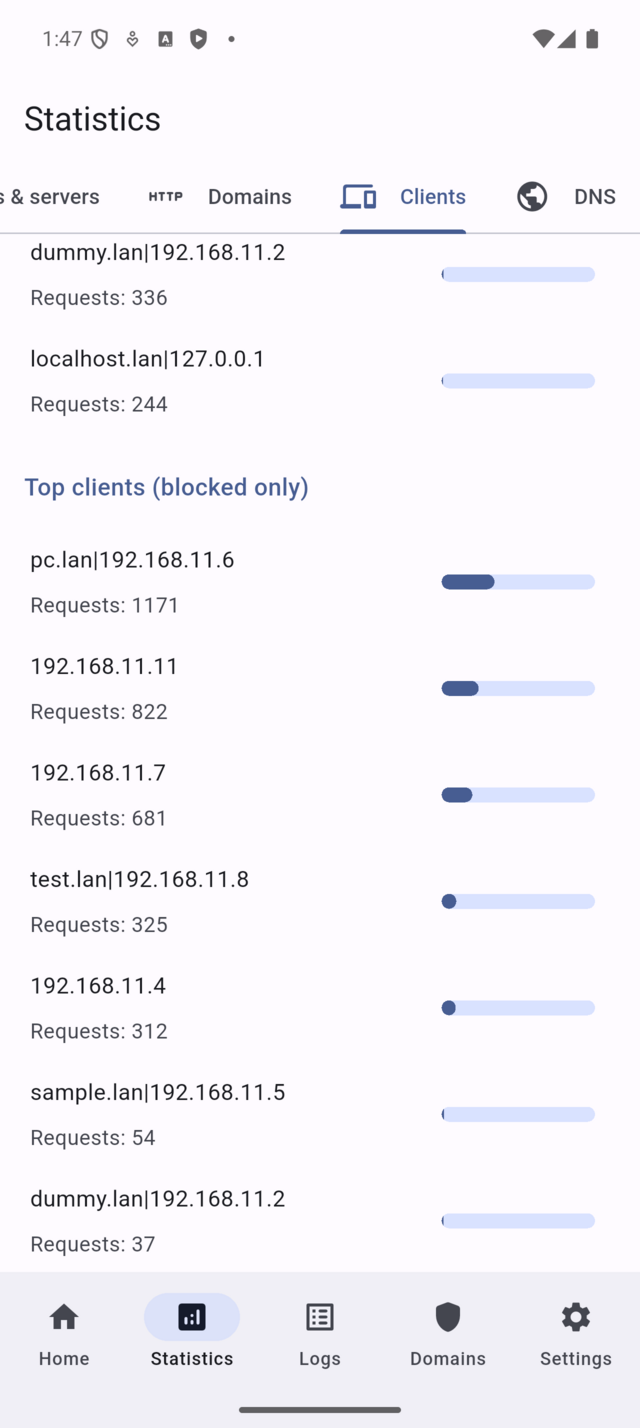
This workflow is useful when one entry dominates the list and you want to confirm whether the traffic is expected or requires action.
Inspect DNS metrics (Pi-hole v6 only)
On Pi-hole v6 servers, the DNS tab provides additional metrics such as query types and DNS behavior.
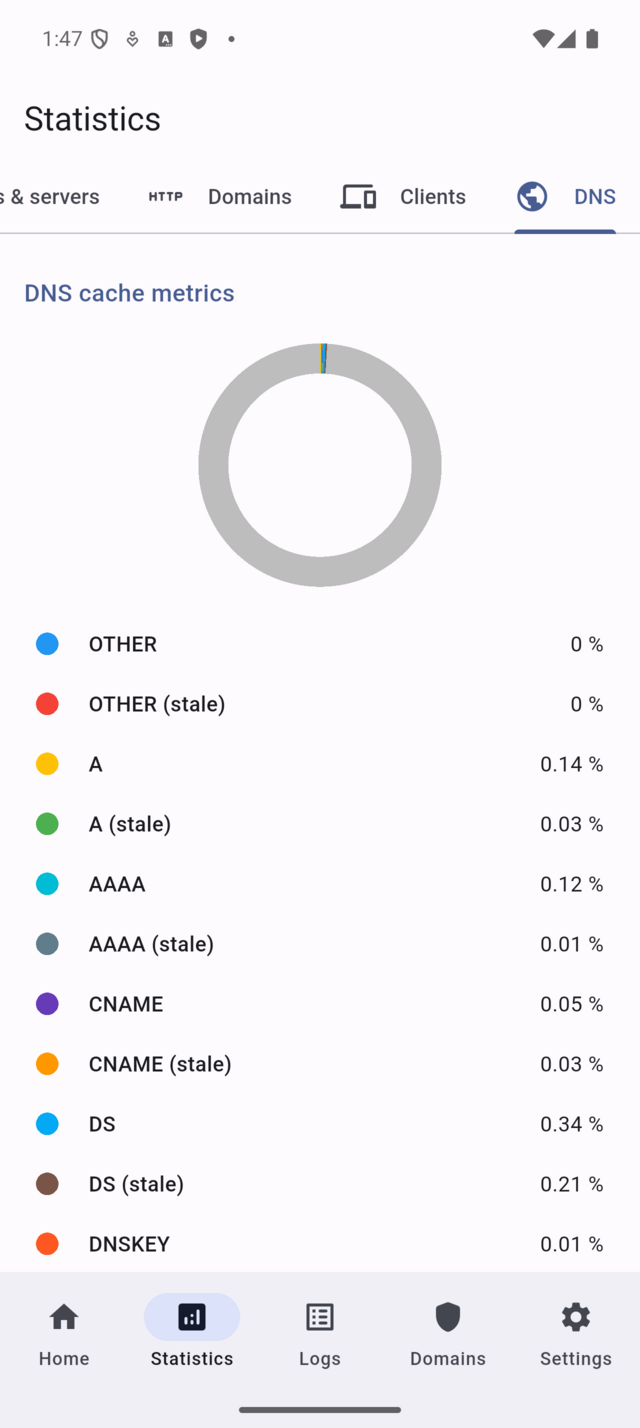
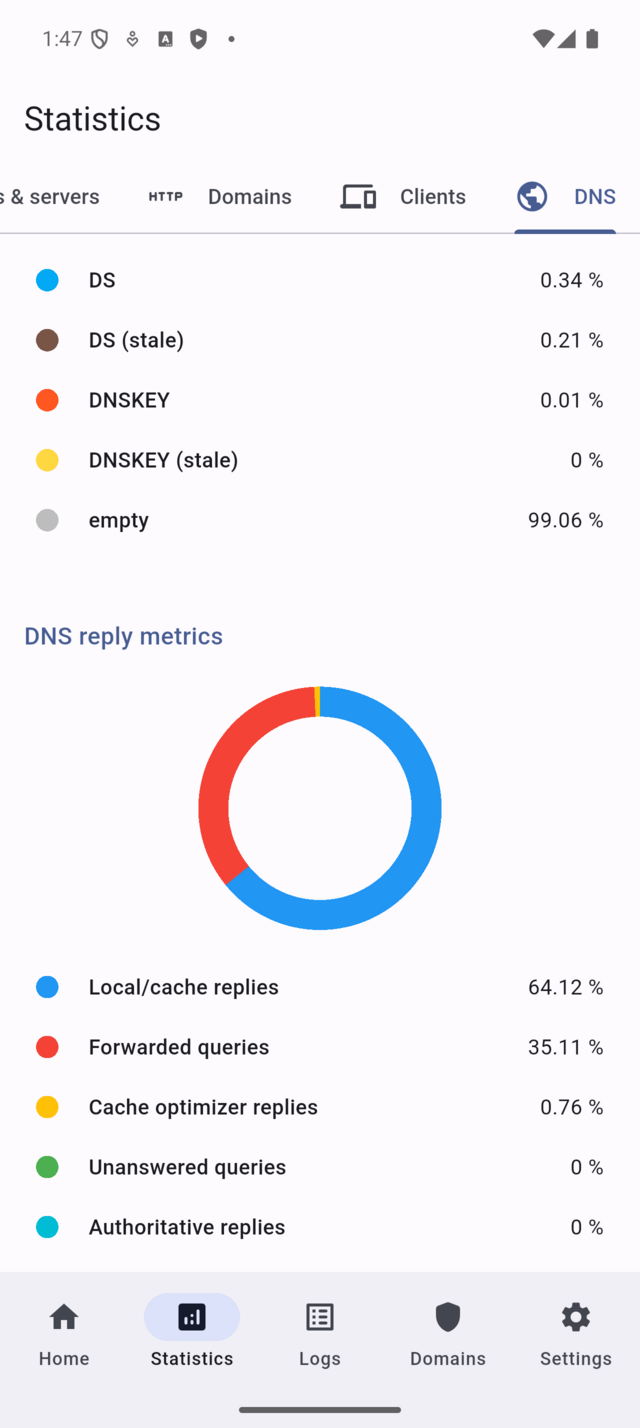
Use this view to confirm that DNS activity looks balanced and normal. If the DNS tab is not visible, the connected server does not support these metrics.
Typical ways to use Statistics
-
Something feels slow Open Statistics, switch to Domains or Clients, and check whether a single entry dominates the traffic.
-
Unexpected traffic spike Use the chart to identify when it started, then tap the top list entry to inspect related queries in Logs.
-
Server-level investigation Start with Queries & Servers to understand upstream routing behavior before narrowing the scope.
Important notes and limits
- Charts are visual only and cannot be tapped.
- Ranked lists may be hidden by Pi-hole privacy settings.
- The DNS tab appears only on Pi-hole v6 servers.
- Statistics are aggregated and may lag slightly behind real time.
Pi-hole concepts used on this screen
Statistics are based on DNS queries processed by Pi-hole. Percentages indicate how much each domain, client, or server contributes to the total traffic volume. Tapping a list entry applies the same filtering logic used in Logs, but with fewer steps.